
Modifications to the Underlying Surveys
The TRIM3 conversion procedures create the input data needed by the simulation modules. Conversion requires both technical and substantive modifications and additions to the original CPS-ASEC input data. The final TRIM3 data include most of the information from the public-use ASEC data as well as other information needed for simulations that is generated by the conversion process.
Conversion makes it possible for different survey data to be used in TRIM3 without making any changes to the model's simulation code. Two different surveys could use the same sampling units and collect the same variables while using completely different coding schemes for those variables and a different ordering of the variables on input records. Without conversion, there would be a need for different versions of the TRIM3 model to read the variables from different locations and interpret the codes in different ways. Conversion has enabled TRIM to use not only CPS ASEC data for simulations, but also American Community Survey (ACS) and even SIPP data.
The conversion process operates on the public-use survey data and includes the following steps.
- Reformatting the data, and loading the data into the TRIM3 database tables
- Performing data checks
- Recoding and creating new variables
- Allocating income across months of the year
- Allocating child care expenses across months of the year
- Generating random numbers
- Incorporating immigrant status imputations and replicating high-income households
- Restructuring "inverted households"
Reformatting the Data
The ASEC public-use file includes household, family, and person records. During conversion of a file, ASEC data are stored in the TRIM3 database in household, family, adult, and person tables. Adult tables contain labor force, earnings and other variables that pertain to "economic adults," i.e., persons aged 15 and older. Person tables contain variables coded for all persons regardless of age. Monthly variables created during the conversion are stored in a separate table in the database which has 12 monthly records for each adult. The database design allows information to be stored in an efficient manner where it can be easily accessed when processing households.
Empty (non-interview) ASEC households are excluded from the TRIM3 database. Conversion also checks for and excludes households consisting entirely of children under the age of 15, though in recent years no child-only households have been found. If a child under the age of 15 has no relatives in a household, TRIM3 places the child in the family of the household reference person (the primary family) or, if the householder has no family, it creates one consisting of the householder and unrelated child(ren). Because child-only families are merged into primary families, there are a few hundred fewer TRIM3 families than there are ASEC families in the final TRIM3 data.
Performing Data Checks
Although ASEC files are well edited by the Census Bureau, a variety of additional edits and checks of the data are performed as part of the data conversion. We generate post-conversion term statistics that are compared with the same statistics generated from the previous years’ data to identify variables showing significant changes. We investigate any variables that show unexpected changes and make any corrections or adjustments in conversion procedures that are required or simply document the changes in the conversion memo and/or TRIM3 dictionary.
Recoding Variables and Creating New Ones
In practice, no two surveys collect exactly the same information. Similar information may be available but collected in different ways. For example, information contained in a variable on one survey may have to be pieced together from several variables on another survey. The ASEC itself changes each year; new variables are added, others are dropped, coding schemes are changed, and methods are altered. Generally, these changes are minor, but periodically there are major changes in the processing and editing methods used by the Census Bureau. Both minor and more major changes are handled by the TRIM3 conversion process.
When required, the TRIM3 conversion software recodes variables to have the coding schemes expected by simulation modules. For instance, the TRIM3 variable HighestGradeCompleted, which has a range of 0 to 18, is a recode of information contained in an ASEC field for educational attainment that has codes of 0 and 31 to 46. With this recoding, TRIM3 simulation code is able to treat HighestGradeCompleted the same from one survey year to another and from one survey source to another.
Conversion also creates new variables from existing ones in order to increase processing efficiency. For example, broad income measures are generated by summing detailed income components; new health insurance variables are generated by combining initial reported information with information from final "catch all" questions; and standard TRIM3 "family type" variables widely used throughout TRIM3 are constructed.
Allocating Income Across Months of the Year
The ASEC and most of the other surveys that might be used by TRIM3 report annual income amounts. However, government transfer programs calculate monthly eligibility and benefits using monthly income information. The conversion procedure must therefore allocate annual income amounts to months of the year. The resulting variables capture the fact that some types of income—especially earnings, but also unemployment compensation, workers compensation, and child support—may not be received evenly across the year.
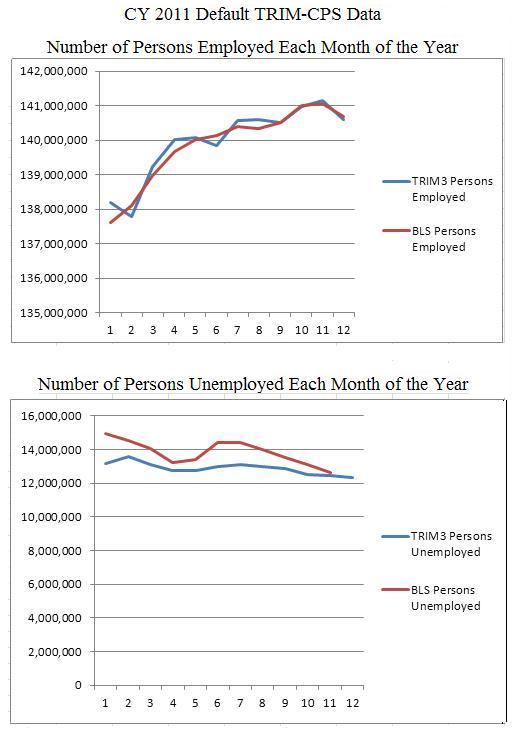
Employment-Related Income. Monthly allocation of employment-related income (earnings, unemployment compensation, and workers compensation) begins by assigning each person’s spells of employment and unemployment to specific weeks of the calendar year. This assignment uses each person’s ASEC-reported data on number of weeks of employment and unemployment and number of different spells of work. The process also uses month-by-month data on total number of employed and unemployed persons from Bureau of Labor statistics that are based on the monthly CPS surveys.1 Each person’s spells of employment and unemployment are assigned to specific weeks in a way that is consistent with his/her reported data, and in such a way that the simulated monthly data show the same trend of employment and unemployment across the months as the BLS data. In other words, if actual employment increased from the beginning to the end of year, then conversion places more weeks of employment at the end and/or middle of the year and fewer at the beginning of the year, following the trend in the BLS data.
The two graphs below show how closely the TRIM monthly assignments track the BLS numbers of employed and unemployed persons each month in the CY 2011 data. The total levels of the assignments in TRIM data are, of course, dependent on the total number of weeks of employment and unemployment reported in the CPS-ASEC survey data.
After the reported spells of work and/or unemployment are distributed over the 52 weeks of the year, the information is stored in monthly variables for weeks worked and weeks unemployed during each month of the year. All months are assigned an equal number of weeks (4.3333)2. A person may work (or be unemployed or out of the labor force) for either all or part of a month.
In the case of persons who report working part-time in some weeks and full-time in other weeks (PT-FT workers), the TRIM3 conversion procedures allocate the part-time and full-time weeks to different months of the year. PT-FT workers who usually work full-time (i.e., reported usual hours worked per week are 35+ hours) are assumed to work 20 hours/week in their part-time weeks; and PT-FT workers who usually work part-time are assumed to work 40 hours/week in their full-time weeks. Conversion procedures compute hours of work during each month based on weeks worked in each month and whether those weeks are part-time or full-time weeks.
Employment-related income is allocated across the months of the year consistent with the assigned weeks and hours of employment and weeks of unemployment. Wages, self-employment income, and farm income are allocated across the months based on weeks and hours of employment. Because all months have the same number of weeks, a person who works full-time for 52 weeks is assigned the same amount of earnings for each month, January through December. Workers' compensation is generally divided over all weeks in which a person was either unemployed or out of the labor force; but 15 percent of recipients are simulated to receive their workers' compensation as a lump sum, all in one month 3.
Beginning with the CY 2009 data, TRIM3 simulations began using a new UnemploymentCompensation simulation module to provide a more sophisticated method of allocating the ASEC-reported unemployment compensation income than is provided by the conversion procedure. Instead of allocating across all weeks of unemployment (with exceptions for individuals with no weeks of unemployment, and incorporating a one-month lag for some recipients4), the Unemployment Compensation module ascertains that the assigned weeks of receipt are feasible, that UC is not allocated over more weeks than the maximum possible weeks of benefits in a person’s state of residence, and that the weekly benefit amount that is assigned falls within the range of minimum and maximum weekly benefit for the state of residence.
Child Support and Alimony Income. The number of months over which alimony and child support income amounts are allocated is determined probabilistically on the basis of look-up tables generated from SIPP data. Separate look-up tables are used for TANF and non-TANF recipients containing probabilities developed from 2005-2006 data from the 2004 SIPP panel. (The tables of probabilities were updated in fall 2011; the conversion of 2010 and earlier survey data used earlier sets of probabilities.)
The tables of probabilities are based on the proportion of persons receiving alimony or child support income in differing numbers of months by annual amount of income received. As an example, SIPP data may show that of the persons who have either alimony or child support income of $5,000 or more a year and no TANF income, 74 percent receive that income during all 12 months of the year. On the other hand, SIPP data may show that persons who have either alimony or child support income of between $1,000 and $2,000 a year who also receive TANF have just a 12 percent likelihood of receiving the alimony or child support income during all 12 months of the year, a 10 percent probability of having received the income for 11 months, a <1 percent probability of having received the income in just 10 months, etc. These probabilities are used to allocate reported annual income amounts over the likely number of months the income was received.
Tables 1 and 2 show the cumulative probabilities used to assign child support and alimony income to months of the year, inflated (or possibly deflated) to the year being simulated. The cumulative probabilities shown in these tables are compared with random numbers to determine the number of months over which to allocate each person’s child support and alimony income.
As an example, if simulation year is the same as the year on which probabilities are based, and a person who does not report TANF income reports child support income greater than $1,500 but less than or equal to $2,500 a year, and her random number is >= 0.5 and < 0.602, then her child support income is allocated to just 7 months. However, if her random number is >= 0.752, then her child support income is allocated equally to all 12 months of the year. However, if this person received TANF, then there would be a higher probability that all of the child support and/or alimony income would be assigned to 12 months. In that case, income greater than $2,000 and a random number >= 0.362 would result in an allocation of the income to all 12 months.
Income amounts are expressed in 2006 dollars and are inflated or deflated to the year of data being converted at the time monthly allocation is performed. An inflation/deflation factor is computed from the Consumer Price Indexes for 2006 and the year of data being converted. As an example, for the CY 2011 conversion, a factor of 1.12 was used to inflate the dollar ranges from 2006 to 2011, increasing the dollar amounts used to define each range in the tables. For example, the <=$500 range corresponds to <=$556 in 2011 dollars, and the >$5,000 range corresponds to >$5556.
| Table 1: Cumulative Probabilities for Persons who Do Not Receive TANF by Amount of Alimony and/or Child Support Income Reported | ||||||||||||
| Number of Months | ||||||||||||
| Amount of Income |
1 | 2 | 3 | 4 | 5 | 6 | 7 | 8 | 9 | 10 | 11 | 12 |
| <=$500 | 0.371 | 0.654 | 0.759 | 0.841 | 0.894 | 0.925 | 0.939 | 0.958 | 0.970 | 0.974 | 0.982 | 1.000 |
| <=$1000 | 0.105 | 0.272 | 0.424 | 0.552 | 0.669 | 0.730 | 0.786 | 0.838 | 0.854 | 0.881 | 0.926 | 1.000 |
| <=$1500 | 0.053 | 0.125 | 0.264 | 0.461 | 0.575 | 0.678 | 0.747 | 0.794 | 0.816 | 0.851 | 0.881 | 1.000 |
| <=$2500 | 0.025 | 0.078 | 0.125 | 0.214 | 0.321 | 0.412 | 0.500 | 0.602 | 0.652 | 0.699 | 0.752 | 1.000 |
| <=$5000 | 0.003 | 0.008 | 0.012 | 0.039 | 0.070 | 0.123 | 0.186 | 0.317 | 0.364 | 0.419 | 0.488 | 1.000 |
| > $5000 | 0.005 | 0.010 | 0.017 | 0.031 | 0.045 | 0.056 | 0.072 | 0.238 | 0.174 | 0.212 | 0.259 | 1.000 |
| Table 2: Cumulative Probabilities for Persons who Receive TANF by Amount of Alimony and/or Child Support Income Reported | ||||||||||||
| Number of Months | ||||||||||||
| Amount of Income |
1 | 2 | 3 | 4 | 5 | 6 | 7 | 8 | 9 | 10 | 11 | 12 |
| <=$500 | 0.377 | 0.605 | 0.664 | 0.773 | 0.891 | 0.971 | 0.971 | 1.000 | 1.000 | 1.000 | 1.000 | 1.000 |
| <=$1000 | 0.000 | 0.170 | 0.319 | 0.844 | 0.844 | 0.886 | 0.886 | 0.886 | 0.886 | 0.982 | 0.982 | 1.000 |
| <=$2000 | 0.000 | 0.000 | 0.307 | 0.254 | 0.358 | 0.441 | 0.470 | 0.656 | 0.775 | 0.775 | 0.883 | 1.000 |
| > $2000 | 0.000 | 0.000 | 0.000 | 0.000 | 0.053 | 0.053 | 0.073 | 0.109 | 0.151 | 0.289 | 0.362 | 1.000 |
Persons who receive both child support and TANF (but not other public assistance) and whose child support divided by months of TANF receipt is equal to their state's pass-through amount are excluded from the look-up tables. Rather, their months of child support receipt is set equal to the reported number of months of TANF receipt. (For example, in a state that allows TANF families to retain $100 in child support each month, a family that reports 12 months of TANF and $1200 of child support is assumed to receive child support for 12 months.) For the conversion of the CY 2011 data, we also modeled the pass-through for states that vary the amount of the pass-through depending on the number of children in a family.
Other Income. All other types of income are divided evenly over the 12 months of the year. Income that is evenly distributed over the year includes asset income (combined income from rents, royalties, interest, dividends, and estates or trusts) Social Security, Railroad Retirement, pension income, veterans payments, regular contributions, educational assistance, black lung/miner benefits, and unspecified "other" income.
Allocating Child Care Expenses Across Months of the Year
Beginning with the 2010 ASEC survey (CY 2009 data), respondents are asked a series of questions designed to obtain the annual household-level child care spending amount. However, TRIM simulations operate at the person and/or family level, and, in many cases, use a monthly rather than annual time frame. Consequently, there is a need to allocate the reported annual household-level child care spending to narrowly-defined families (when a household consists of multiple families) and to months. For the 2011 and 2012 ASEC, this allocation was performed out-of-model in SAS, and the results were imported into the TRIM database for use by simulation modules. The methodology has now been incorporated into the C++ TRIM3 conversion code.
The procedure allocates household-level child care spending across narrowly defined families in multiple-family households, treating related and unrelated subfamilies separately from a household’s primary family. The procedure determines the number of children in each family that require paid child care so that a parent/guardian can work (indicated by the ASEC variable PAIDCCYN, TRIM variable ParentsWorked), and the number of weeks worked by the head and spouse of each family (indicated by the ASEC variable WKSWORK, TRIM variable LastWeeksWorked). The allocation is based on the assumption that the head and spouse of a family are the persons whose work necessitates the child care, though that assumption may not apply in a few complex multi-generation households.
With this information, the number of child-care-weeks needed by each family is determined by multiplying the number of weeks that child care is needed by the number of children identified as needing child care. The assumption is that each child identified as needing care so a parent can work needs care for each week that the head of the family is working. However, if there is a spouse, and he/she is working fewer weeks than the head, the assumption is made that child care is needed only when the spouse is working. Household-level spending is allocated to each family based on the proportion of the family's child-care weeks to the total number of child-care weeks needed by all families in the household. In some households reporting child care expenses, the family heads report 0 weeks of work. These family head(s) may not be able to provide child care due to a non-work related reason (disability, student status, etc.). For purposes of the allocation of child care expenses across families, we treat families who have children needing care and 0 weeks of work as if they had reported 52 weeks of work.
The allocation procedure then spreads each family’s annual spending across the months that the "care-giving" parent is working. The care-giving parent is the parent who is assumed to provide child care when he/she is not working and is the same parent used in the previous step to determine the number of child-care-weeks required by the family (i.e. the parent who can only work if child care is obtained). The amount of spending allocated to each month is proportional to the number of weeks the care-giving parent worked during that month. For example, if the care-giving parent worked 2 weeks in one month and 4 weeks in another, twice as much spending is allocated to the second month as is allocated to the first month. This method of allocating dollar amounts to months based on weeks worked is used in other TRIM monthly-allocation procedures, using the fractional portion of the annual number of weeks worked that is allocated to each month and stored in the TRIM monthly variable ByWeeksWorked. For TRIM3 simulation purposes, the amount of child care spending allocated to each month is stored with the family head, regardless of whether or not the head is considered to be the care-giving parent.
Generating Random Numbers
Random numbers are used in many TRIM3 modules to determine whether a person or unit with a certain probability of some outcome will actually have that outcome. For example, random numbers are used in deciding whether a unit that is eligible for TANF will actually receive TANF benefits. A unit's characteristics determine its probability of participation, and a random number between 0 and 1 compared to that probability determines whether the unit will participate. For example, if a probability is .73, then any random number of .73 or less results in participation. Random numbers are also required by various imputation functions when variables needed by the model are not present in the raw survey.
Some TRIM3 simulations create random numbers when those simulations are run; other random numbers are generated during conversion and are stored in database tables. At whatever point they are generated, TRIM3 generates different random numbers for each task requiring them so that there will be no unintended relationship between, for example, the SNAP participation decision and the imputed number of able bodied adults without dependents to exempt from the work requirement. The random number seed used in generating a random number series is derived from household and person identifiers and month (if the random number is monthly). This ensures that if a module using a random number is run twice on the same input file with the same program rules, the results will be exactly the same.
Incorporating Immigrant Status Imputations and Replicating High-Income Households
Conversion procedures are run twice on the same CPS-ASEC input data, creating two different TRIM3 input schemas. We initially convert ASEC data without incorporating immigrant status imputations and without replicating any high-income households. Then, once imputed immigrant status information is available, we merge that information into ASEC data, replicating (or "cloning") certain immigrant households in the process. When replicating households, we split household, family and person weights so that we can match population subgroup targets, yet weight totals remain the same as in the original data. Beginning with the 2004 ASEC conversion, we added a second household replication and split of weights so that when TRIM3 data are matched with Statistics of Income (SOI) data, there are more unweighted high-income households for matching with SOI high-income units. This second version of the input data is considered the default version and is the version used as input to the baseline simulations. The initial version is used only if needed, prior to the availability of the default data.
Details of the Immigrant Replication. The legal status imputation process first determines whether each non-citizen appears to be either a refugee/asylee or temporary resident; for non-citizens who do not appear to be in one of those two groups, the process determines the probability that the non-citizen is a legal permanent resident (LPR) vs. an undocumented immigrant. The probabilistic nature of the assignment of LPR vs. undocumented status is implemented through replication of immigrant households. For example, for a two-person household with one non-citizen, if the non-citizen was determined to have a 40 percent probability of being an undocumented alien and a 60 percent chance of being an LPR, the final data would include two versions of the household. The first version would have 40 percent of the weight and the non-citizen would be coded as undocumented, while the second version would have 60 percent of the weight and the non-citizen would be coded as an LPR. Larger households might have additional replicates. The maximum number of replicates for any given household in the CY 2011 data is six, including the original instance of the household.
Details of the SOI High-income Split. To increase the un-weighted count of high-income households in TRIM3 data, we identify high-income cloning candidates and create four additional copies of the selected households. Thus, each high-income clone is represented in the TRIM3 data five times, and household, family, and person weights are equally split among the clones so that they sum to the original ASEC weights.
To be identified as a high-income cloning candidate, a household must consist entirely of U.S. natives to avoid the possibility of replicating the same household for both the high-income and immigrant-imputation cloning. In addition, households are required to have a family with a poverty rate at least 4.5 times the family’s poverty threshold; and the household must have at least one person with a top-code earnings flag indicating earnings were top-coded (ASEC fields tcernval, tcwsval, tcseval, or tcffmval), or a top-coded value for one of the following income types: survivors income (sur-val1 or sur-val2), retirement income (ret-val1 or ret-val2), interest income (int-val), dividend income (div-val), rental income (rnt-val), alimony income (alm-val), or other income (oi-val).
HighIncomeClone is coded from 1 to 5 for households selected for cloning so that a single clone may be identified in work for which this information is needed.4 Most households are coded 0, which indicates they are not high-income clones.
Restructuring Inverted Households
With the conversion of CY 2011 CPS-ASEC data, we incorporated a new procedure into conversion that alters the family structure in some CPS-ASEC households. "Inverted households" are households in which a teenager, young-adult student, or young adult with a disability is identified as the householder, even though (s)he lives with one or both parents. Inverted households are problematic for several of TRIM3’s simulations, including TANF (identifying potentially-eligible children) and federal and state income taxes (determining dependency relationships), and could potentially lead to inaccuracies in determining the family unit for Medicaid eligibility under the Affordable Care Act.
The conversion code alters the family structure and household and family relationship codes in all the inverted households that meet the screening criteria of age and marital, student and disability status of the householder, and presence of at least one parent. No households headed by a married young person are recoded. In the targeted households, a parent is recoded as the householder, and the original householder is made a part of a parent’s primary family if she does not have a child of her own, else a related subfamily is created for the young parent and her child(ren). This recoding affects only a few hundred households, approximately half a percent of the number of interview households in a public-use CPS-ASEC dataset. Restructured households are identified by the household-level TRIM3 variable RestructuredHousehold, and the original family identifier (ASEC variable ffpos) is retained in the person-level TRIM3 variable ASECFamilyID.
_________________________________1 The historical data are shown in the ‘A’ Tables, employment and unemployment status for the total civilian population (from tables showing statistics by sex and age), not seasonally adjusted, shown at the following link: http://www.bls.gov/cps/cpsatabs.htm.
2 Prior to conversion of the 2003 ASEC data, four months were assigned 5 weeks, and the remaining months were assigned 4 weeks. A week with days in two different months was assigned to the month in which most of its days fell.
3 Fifteen percent of persons who receive workers compensation are selected to receive the workers compensation in a single lump sum, and a one-month lag is imposed for 29 percent of recipients of unemployment compensation. Both of these percentages are based on an analysis of CY 2002 data from the 2001 SIPP panel.
4 For years prior to CY 2005 HighIncomeClone is a flag that is coded either 1 for households selected for high-income cloning or 0 for all other households.
 TRIM3 ©2012